Understanding complex Ruby application with profiling tools
by Paweł Świątkowski
03 May 2020
For a long time profiling Ruby apps sounded like a low-level endavour to me. Performance-critical algorithms or C-level stuff - that’s where it shall shine. An excellent example was the discussion about slower boot time in macOS. But can it be helpful to achieve a high-level overview of problems in a very complex codebase, such as a Rails app? I thought not - all the HTTP things, database calls, framework internals would make the output illegible and useless. Well, I was wrong. With the right set of tools, you can get a good grip of what’s happening inside your application. Even better than by code analysis and random benchmarking. Here’s what I learned during last 8 months or so.
The problem
I picked Consul as an example on which I’m going to work. It’s a fairly big open-source Rails application for citizen participation. I was working on a pull request to consul some time ago and doing that I noticed something I thought was weird. Let’s take at a look at a simple test like this:
# spec
let(:proposal) { build(:proposal) }

it "is valid" do
  expect(proposal).to be_valid
end

# result
Proposal
  is valid

Finished in 3.16 seconds (files took 6.28 seconds to load)
1 example, 0 failures
It takes almost 10 seconds to run it. More than six seconds out of it are spent is setup phase, but the spec itself takes more than 3 seconds. Something’s fishy here and let’s see what!
The investigation
To find out we are going to use two tools:
- speedscope – a browser-based tool to display profiling results in a way that we could use for our benefit
- stackprof – a profiler for Ruby. There are a few tools like this available, but some time ago only stackprof’s output could be used with speedscope (now it supports other too)
For the setup, assuming you have already cloned Consul and bundle install‘d:
- Add stackprof to the
Gemfile(gem "stackprof") - Install speedscope, if you haven’t already (
npm install -g speedscope) - Prepare a helper script, which will run the profiling and save the results. I called mine
profile_spec.rb:
require 'stackprof'
require 'rspec/core'

GC.disable # we'll talk about it later
profile = StackProf.run(raw: true) do
  RSpec::Core::Runner::run(['spec/models/proposal_spec.rb:16'], $stderr, $stdout)
end

require 'json'

File.open("profile.json", 'w') { |f| f.puts(JSON.dump(profile)) }- Run a script (
bundle exec ruby profile_spec.rb). This will createprofile.jsonfile. I would discourage opening it in a text editor, as it 5 megabytes of JSON. But if you want to - I won’t stop you. - Instead, open it with
speedscope profile.json. This should open your browser and load the profile (it might take some time, as the file is large).
If everything went OK, you should see a somewhat intimidating image like this:

What is here? First of all, it is a timeline. On the top you can see that everything took less than 9 seconds. This is more or less equal to what we’ve seen earlier when we ran the test. The blocks are units of code (basically functions). The ones that are higher in the stack are more general. What happens in them is broken down in lower lines.
Going from the top, first few lines are useless, because they span the whole timeline. It’s the most general level, which you can tell by the label <main> on them. Below we have some RSpec functions, also spanning the whole timeline. But after them things are getting a bit more interesting. We can see that the line has been split into two blocks. First one says RSpec::Core::Runner#setup and you can see it took a bit more than 6 seconds, while the second is RSpec::Core::Runner#run_specs. Judging by the name, you could say that those are preparations for running the test suite and actually running it.
If you compare with output from RSpec (Finished in 3.16 seconds (files took 6.28 seconds to load)) you should notice that these are the same numbers of seconds.
For now, we don’t want to look at the setup part, after all we are interested what takes so long in a test itself. If you double click on RSpec::Core::Runner#run_specs, speedscope will zoom in on it, so we can see better what’s inside:
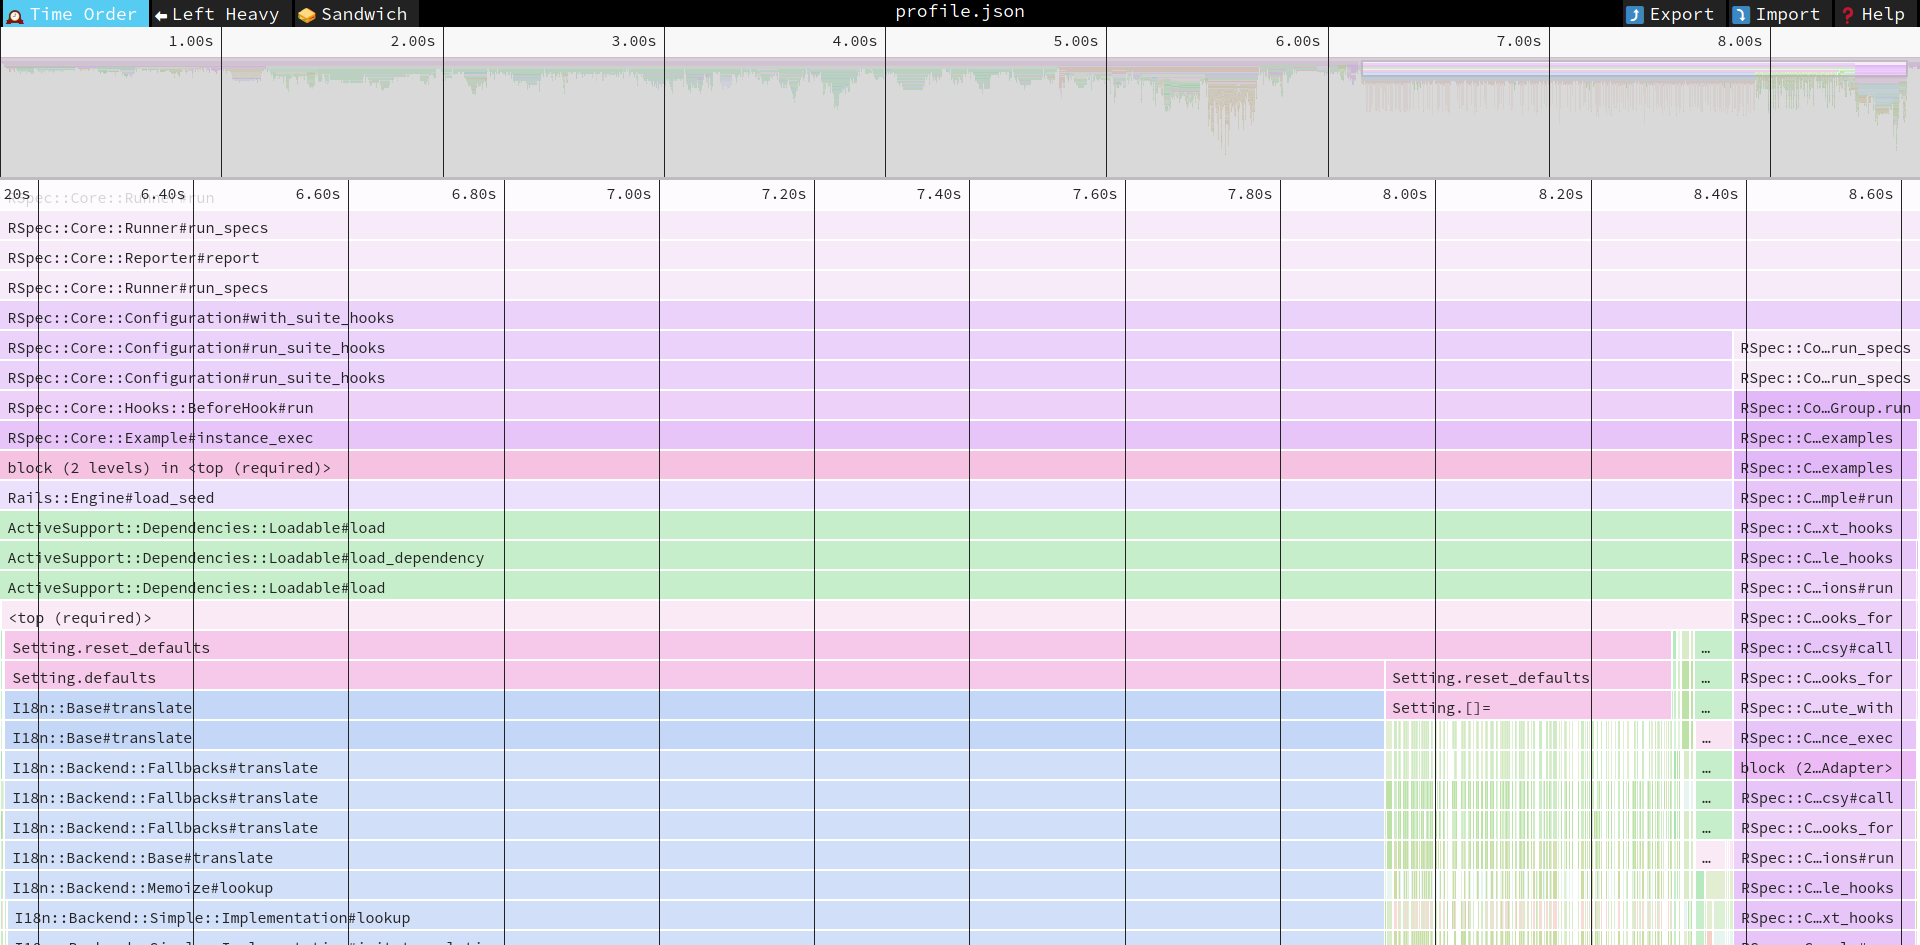
You can see the same pattern. The top lines span the whole screen width (that’s what we wanted) and then in the 5th line it splits into two parts. The shorter one on the right has its label clipped, but if you hover on it, you can see it says RSpec::Core::Runner#run_specs. This is an actual execution of the spec. The large part on the left is the preparation work. Further down we can see some labels that look familiar (RSpec::Core::Hooks::BeforeHook#run, Rails::Engine#load_seed) and other are just pure technical rubbish (examples are ActiveSupport::Dependencies::Loadable#load, which is just ActiveSupport’s black magic). You’ll have to learn to ignore the rubbish and look further down immediately in search of meaningful blocks.
The <top (required)> label means that some Ruby file was loaded. When you click on it, the “stack console” will open up on the bottom of the screen. You can check which file we are talking about there:
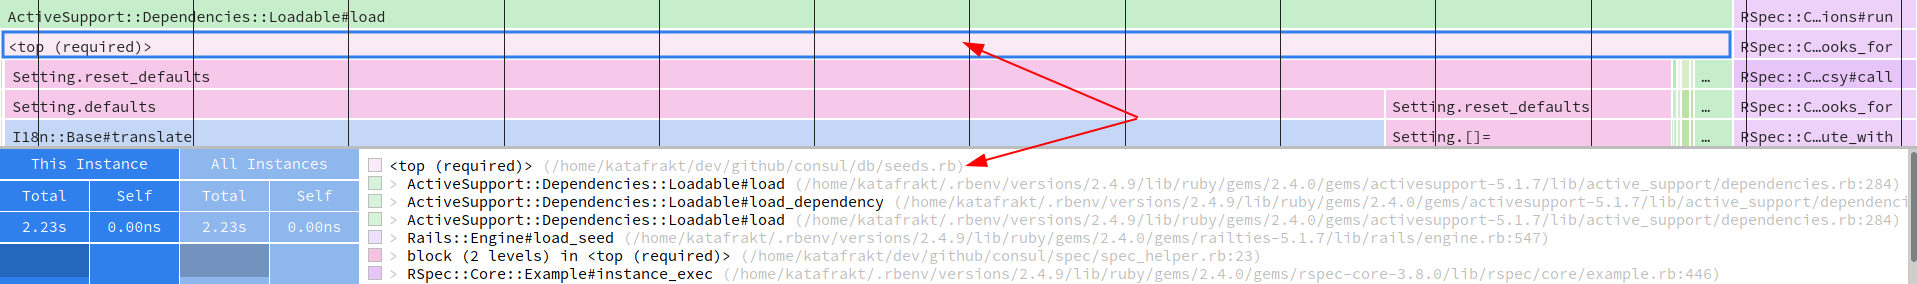
After this line we finally see a block created by code in our Consul app! The Setting.reset_defaults took 2.15 s to run, and below you can see that 1.78 s was spent in Setting.defaults and 370 ms in Setting.reset_defaults (again). This is the time to look at the code. But before that, let’s notice that almost 100% of defaults is spent in I18n. We are going to use that fact.
The code for reset_defaults looks like this:
class << self
  def reset_defaults
    defaults.each { |name, value| self[name] = value }
  end
end
In speedscope we’ve seen two blocks for those methods and there are also two parts here. One is calling defaults and it takes 80% of the time. The other is each + block - 20% of time. It’s obvious by now that the main problem lies in defaults method. This method, however, it simply returning a super-long hash with string keys and some values. Should it take so long? No, of course not. If you know what to look for, you’ll find these lines:
# Names for the moderation console, as a hint for moderators
# to know better how to assign users with official positions
"official_level_1_name": I18n.t("seeds.settings.official_level_1_name"),
"official_level_2_name": I18n.t("seeds.settings.official_level_2_name"),
"official_level_3_name": I18n.t("seeds.settings.official_level_3_name"),
"official_level_4_name": I18n.t("seeds.settings.official_level_4_name"),
"official_level_5_name": I18n.t("seeds.settings.official_level_5_name"),
Now we can make an educated guess what the problem is. When the hash is created, it calls I18n.t to set a couple of values. This triggers all Rails’ heavy autoloading machinery, loading YAML files with translations and then evaluating them. Consul is translated into many languages and has a lot of strings. Loading all of them must take some time.
After a quick session of grepping around I found that Setting.reset_defaults is used in three contexts:
- To seed a server after installation
- To set up a dev server
- Before a spec suite is running
The first two usages need access to translated string, otherwise it would look stupid to set up a website in Spanish, but get English official names in it. However, for testing purposes we can afford to not care too much and just put some random string, not correct translations (we are using default locale anyway). Let’s change it in this fashion:
"official_level_1_name": Rails.env.test? ? 'official 1' : I18n.t("seeds.settings.official_level_1_name"),And the result is:
Randomized with seed 39243

Proposal
  is valid

Finished in 1.05 seconds (files took 5.96 seconds to load)
1 example, 0 failures
Good! We went down more than 2 seconds compared to the original run, from almost 10 seconds to just above 7.
Where to go from now?
This is just a start and by analyzing the profiling results you surely can get some more savings. Here’s updated screenshot from speedscope with some annotations:
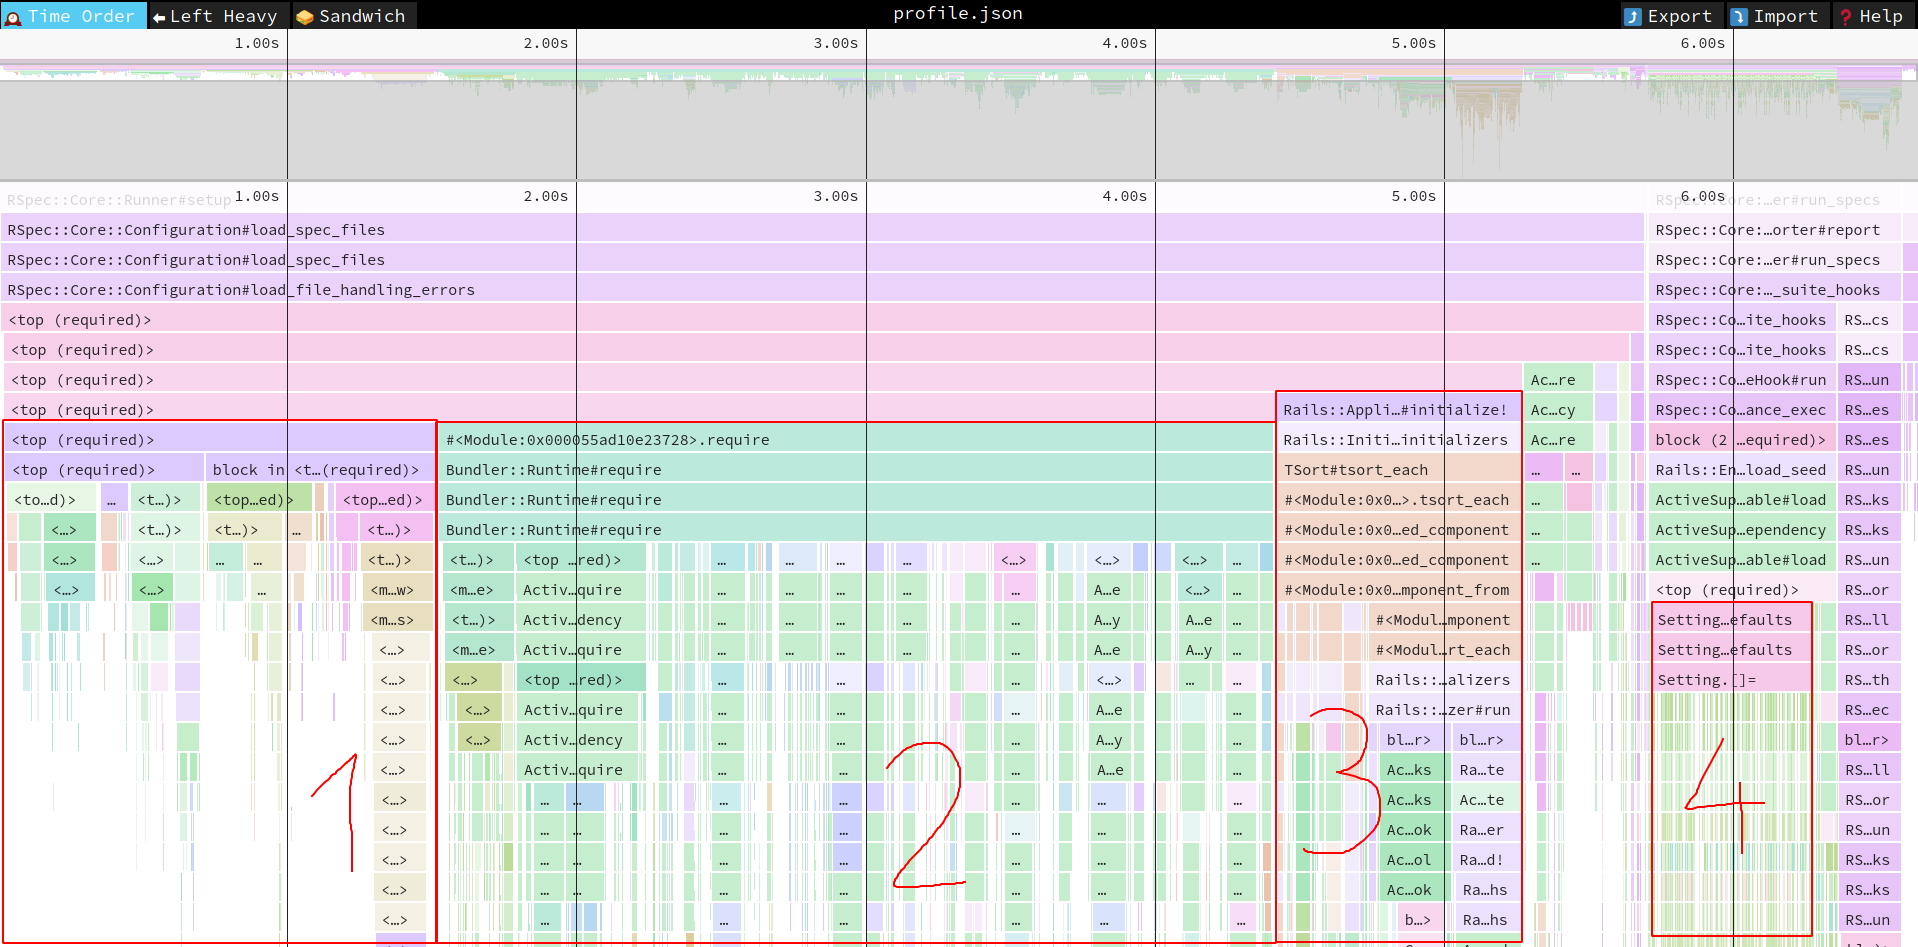
- This is just Rails loading. Probably not much you can do here, unless there is some part of rails you’re not actually using (ActionText, ActiveJob etc.). Although it’s interesting to see how heavy loading Rails is…
Bundler::Runtime#requireis when the app has evaluated theGemfileand now starts torequireevery gem listed there. In this case, it takes 2.89 seconds. That’s a lot. The ones taking most time areahoy_mateyandacts_as_votable. The usual solution here is to addrequire: falsein the Gemfile and require the gems when they are really needed (for example, you probably have only a handful of models that can be voted on, so require acts_as_votable on top of their files and when you test other models, it does not need to be loaded at all).- Initializers. This is a broad topic, as initializers are a double-edged sword. They are very convenient, but they are run every time you load Rails environment - in a Rake task, in console startup, in server start… Perhaps there is some way to lazy load things you set up in initializers. My solution is to use a dry-container with memoization and resolve as late as possible.
- We’ve seen it before. This is a 370-milliseconds code that takes each key-value pair from
Setting.defaultsand writes them into the database. It’s 98 entries, hence 98 database calls. Maybe in tests, instead of having these in the database, you can actually store it in the memory? At least in the ones that are not checking if setting have been persisted in the database (so, in most of them).
The list could go on and I’m sure that with some work we could have our single test be running in under 5 seconds, which is half of the time we have at the start.
What about GC?
When I showed you a script to perform profiling, there was GC.disable in it. Why? Because in large app garbage collection happens often, making the resulting image illegible and hard to reason about:
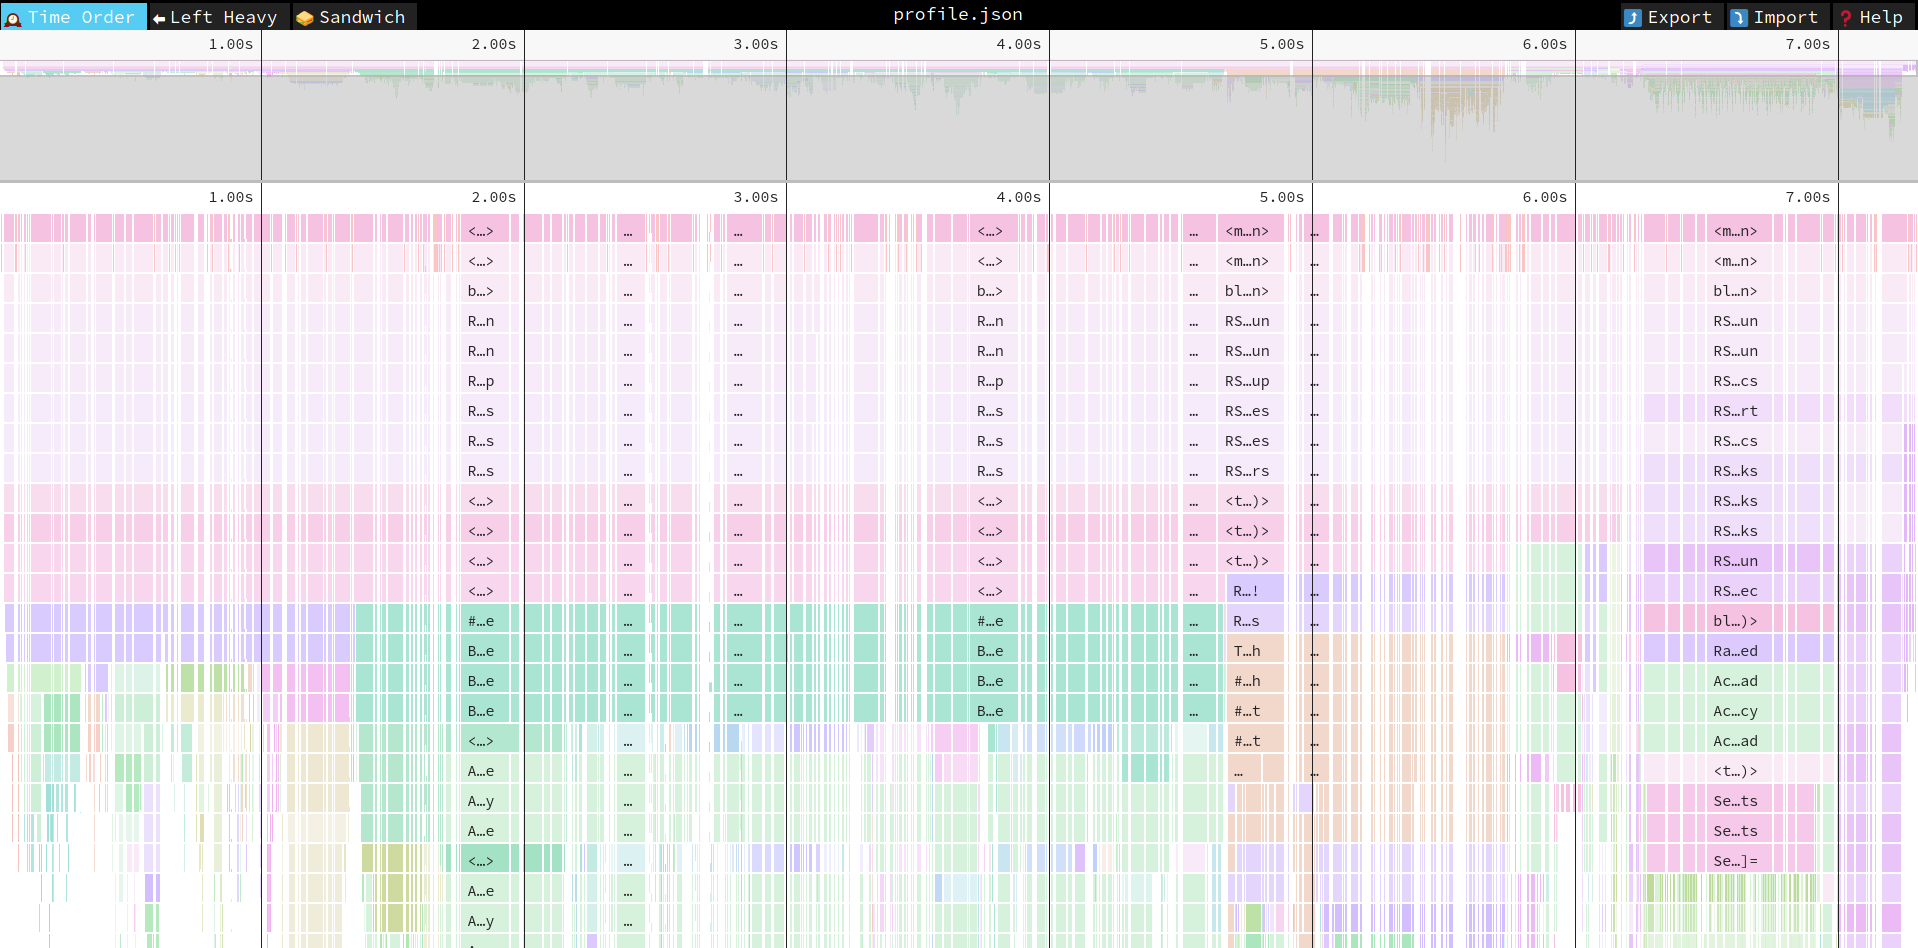
Remember though that in reality you run the app with GC enabled. While for investigation reasons it’s good to disable it, you should check how it looks with GC enabled too. There are two others speedscope views that can help you here.
First one is a “sandwich view”. This is more or less what we know as the result of profiling. It contains summed up values for each method call, ordered by “self time” (i.e. time spent in the function itself, not in the functions called by it).
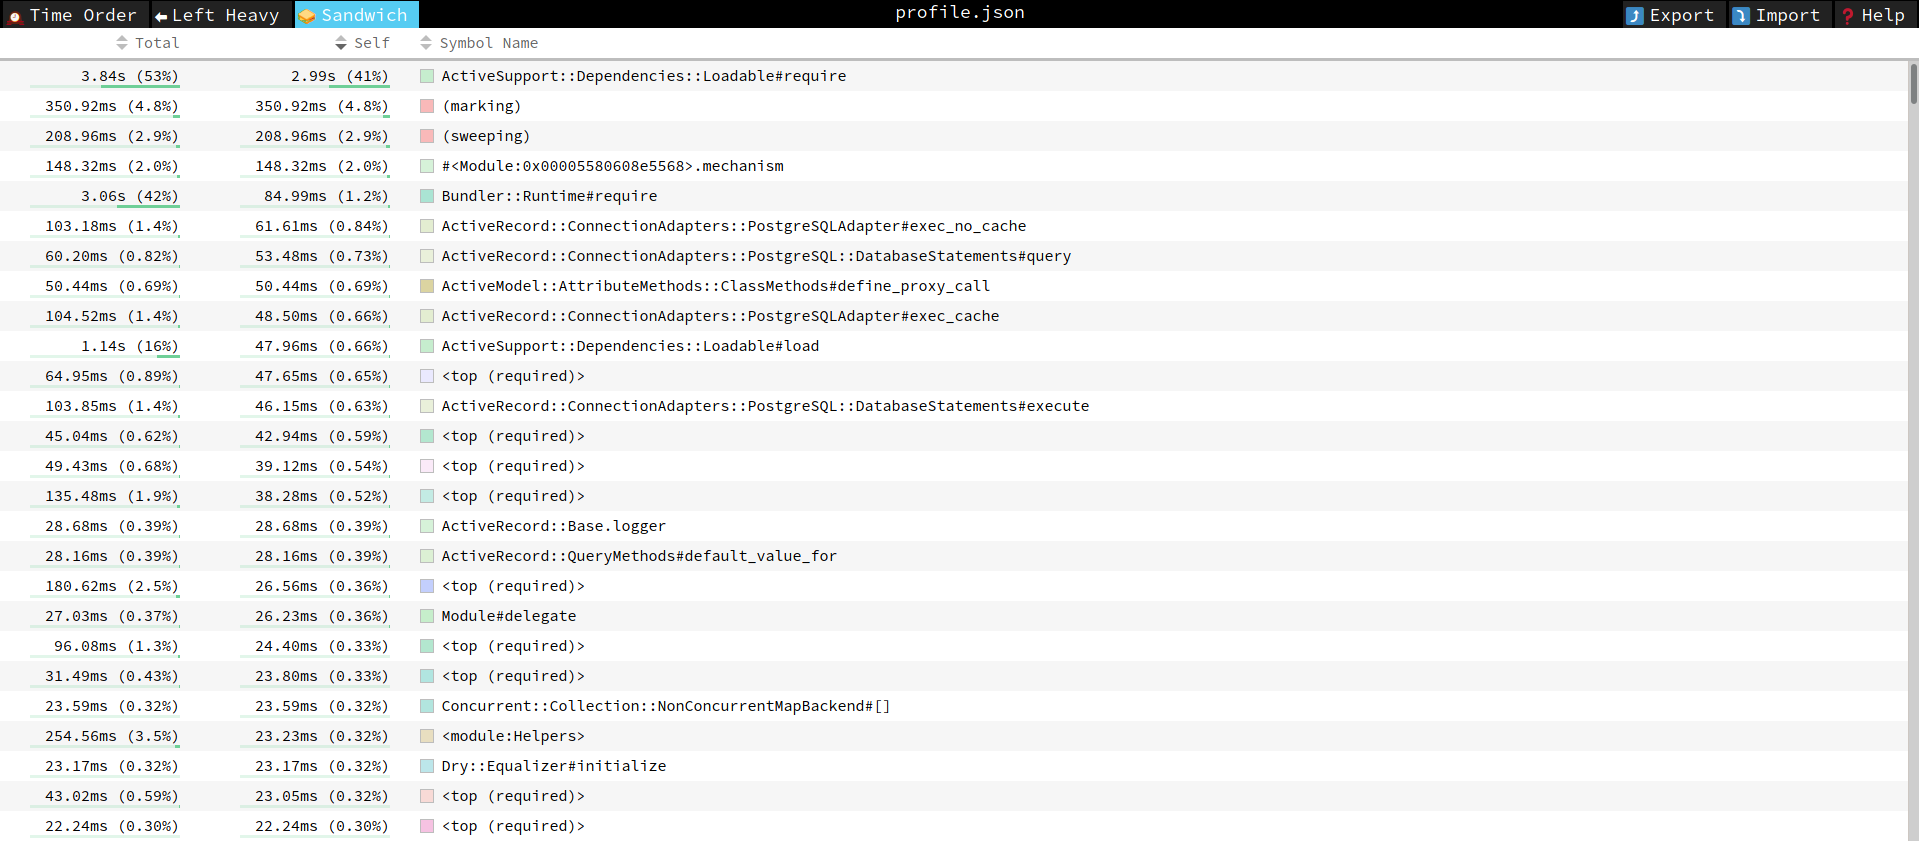
We can see here that garbage collection took just a bit over half a second. This is quite a lot and maybe tuning the GC in development would also positively affect the performance.
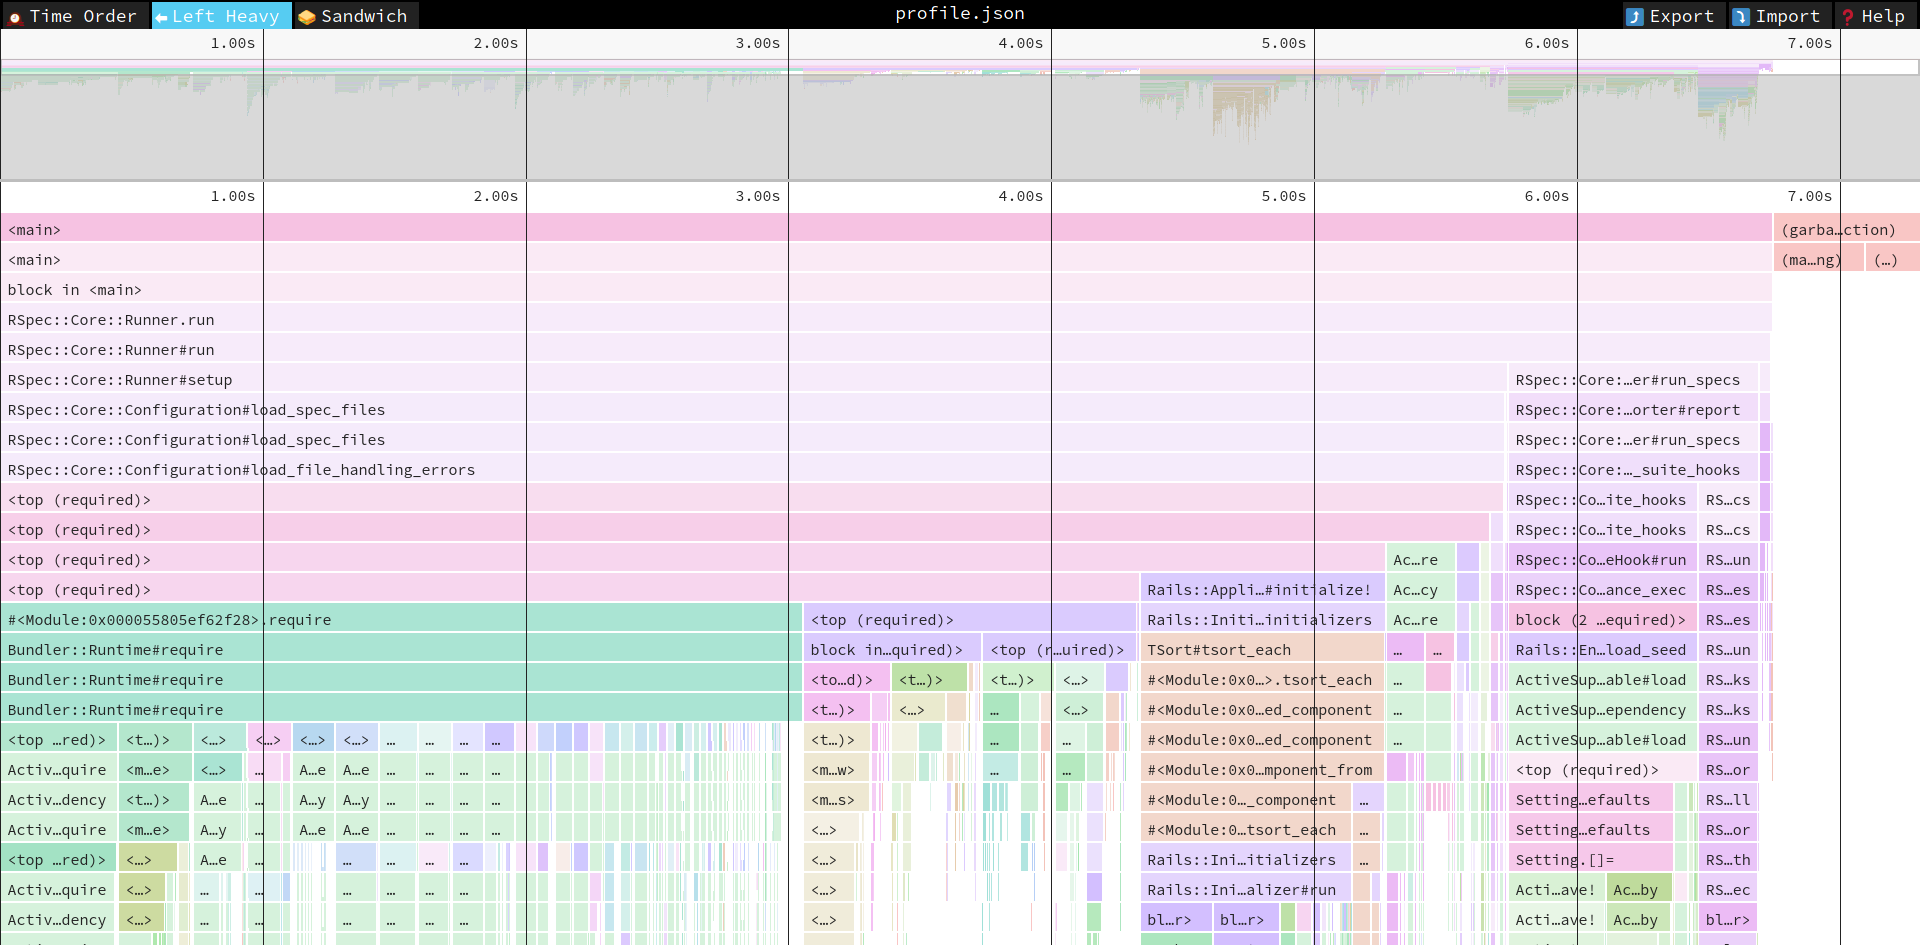
The other is “left heavy” view. I don’t use it a lot (although I probably should), so I’ll let the author of speedscope explain:
In the “Left Heavy” view, identical stacks are grouped together, regardless of whether they were recorded sequentially. Then, the stacks are sorted so that the heaviest stack for each parent is on the left – hence “left heavy”. This view is useful for understanding where all the time is going in situations where there are hundreds or thousands of function calls interleaved between other call stacks.
This is how it looks for our Consul test. It’s still a good way to see what calls what and wthe time is spent. But this is not a timeline anymore, so it’s less helpful in understanding the lifecycle of your code.
Further reading
- Julia Evans, the author of rbspy, has a series of articles about writing it and profiling in general. I’d suggest to start with How do Ruby & Python profilers work?. By the way, rbspy is awesome and let’s you profile a running Ruby program without having to do any prior preparations to it. I recommend looking at it. Oh, and it supposedly should coöperate with speedscope too.
- Rbspy’s documentation itself contains a very useful article on reading flamegraphs. Speedscope is actually an icicle graph, which is a type of flamegraph. If you’re lost somewhere in understanding your profiling data, reading it can help.
- Ruby Profiler Types and Why You Need Them concentrates on providing an overview on profiling landscape in Ruby. What tools are available and which is good for which (because bear in mind that speedscope + stackprof is not a silver bullet, sometime you’d need something else).
- A series of blog posts by Emil Soman describes a process of building a simple instrumentation profiler. It’s worth reading, as stackprof and rbspy are sampling profilers, a different type and different idea. The first article in series (which I linked to) explains the difference.